Component Reference
This lesson demonstrates every available shortcode and Markdown style. Use it as a copy-paste reference when writing new lessons.
Typography
Regular paragraph with bold, italic, bold italic, strikethrough, and inline code.
This is a blockquote. Use it for quotes or secondary context.
Headings
Use ## for section titles and ### for subsections. The # heading is reserved for the lesson title (rendered separately).
Lists
Unordered:
- First item
- Second item with bold
- Nested list:
- Sub-item A
- Sub-item B
Ordered:
- Step one
- Step two
- Step three
Code block
# Example: calculating VWAP
vwap = sum(price * volume) / sum(volume)
print(f"VWAP: {vwap:.2f}")
Table
| Indicator | Best For | Timeframe |
|---|---|---|
| Volume Profile | Support/Resistance | Intraday |
| Footprint | Order Flow | Scalping |
| Delta | Buyer/Seller pressure | Any |
Link and image
Visit ATAS website for more tools.
Callout Variants
Note — general information or context the reader should be aware of.
Tip — a useful technique or best practice.
Important — something critical the reader must not miss.
Warning — potential pitfall or common mistake to avoid.
Key Takeaway
- Volume confirms price moves — high volume = conviction, low volume = doubt
- Always check delta before entering a trade
- Footprint charts reveal what candlesticks hide
Before / After Slider
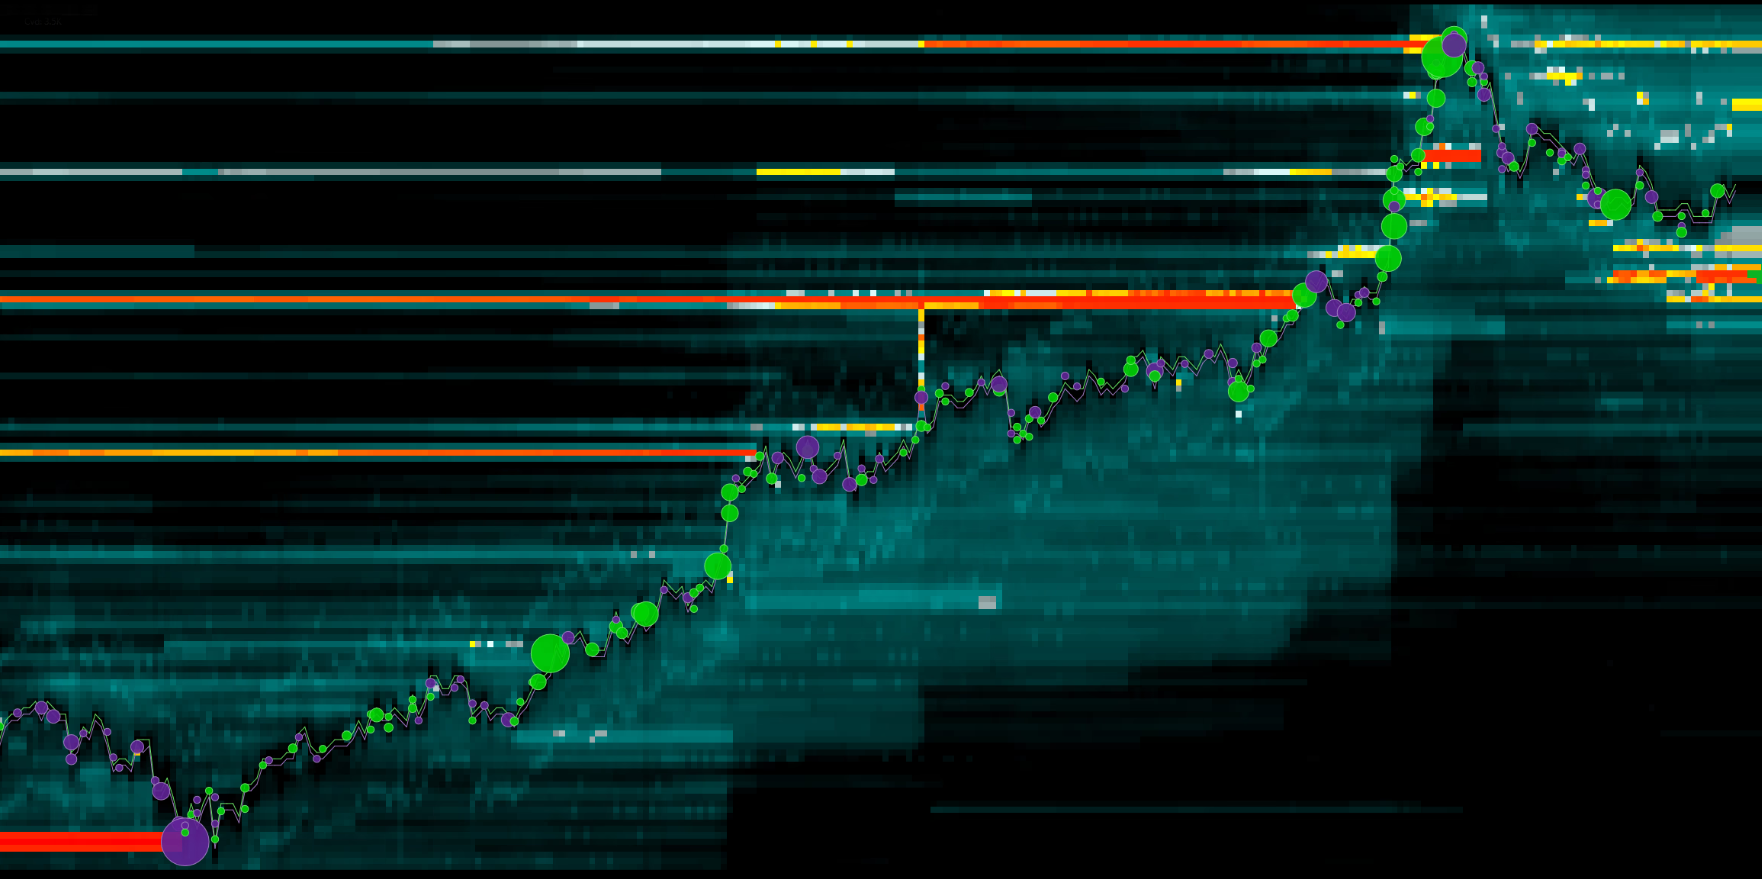
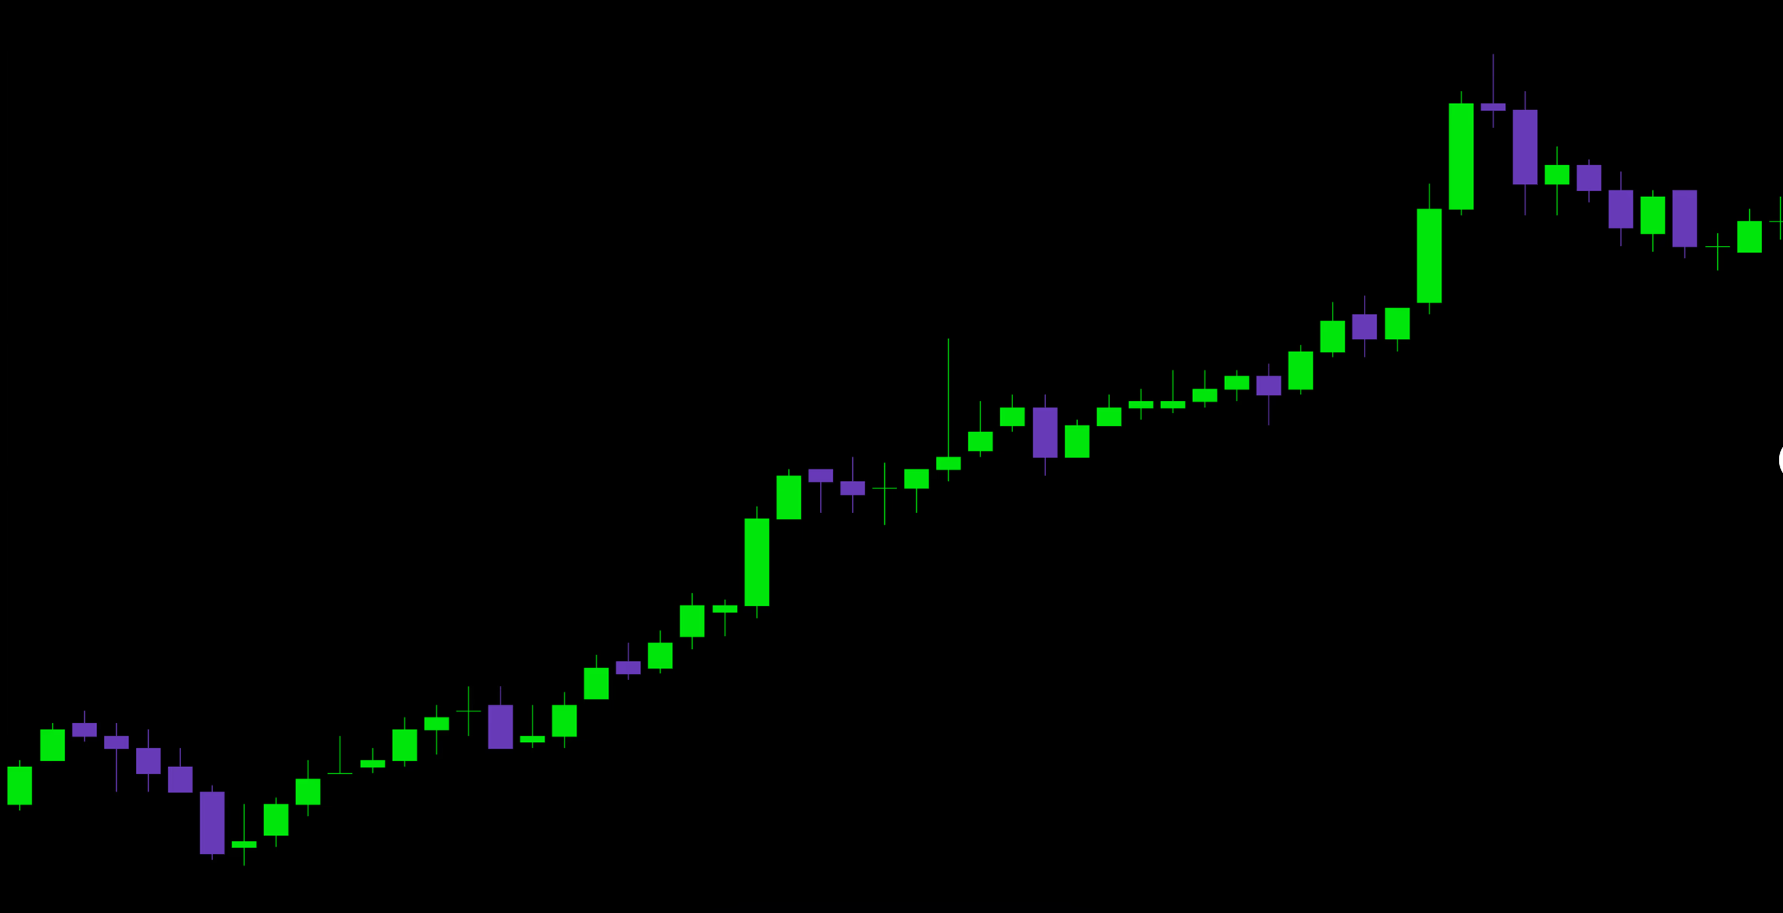
Candlestick Chart
Default chart with demo data:
Chart with volume bars:
Volume Profile
Horizontal histogram of traded volume by price level with POC and Value Area:
Volume Profile Chart
Multiple volume profiles side by side with shared price axis, POC and Value Area per column:
Video Embed
Try in ATAS
Volume Profile
Volume Profile shows the distribution of traded volume at each price level over a chosen period. It reveals where the market spent the most time (Point of Control) and key support/resistance zones.
Footprint Builder
Interactive step-by-step footprint construction from raw ticks:
Cluster Chart
Cluster chart showing multiple bars with bid/ask butterfly histogram and candle highlights:
Matching Engine
Step-by-step matching engine simulator showing how a market order consumes liquidity from the order book, generates prints (trades), and builds a footprint. Three synchronized panels update together on each step:
Market BUY 15 — eats through the first three ask levels
Next: Market BUY 15
Order Book
Time & Sales
Footprint
CVD Chart
Dual-pane chart: price candlesticks on top, CVD (Cumulative Volume Delta) candlesticks on the bottom. Trend lines show convergence/divergence between price and CVD:
Combining Components
You can mix shortcodes with regular Markdown freely:
Before reading the footprint, make sure you understand bid vs ask. Bid = volume traded at the bid price (sellers), Ask = volume traded at the ask price (buyers).
Then try the interactive builder above to see how each tick fills the footprint grid.
- Green (Ask) volume on the right, Red (Bid) volume on the left
- Delta = Ask − Bid for each price level
- Positive total delta = more aggressive buyers