Imbalances, POC, and delta are individual elements. Patterns are recurring combinations of these elements that visualize potential analytical signals.
Stacking: imbalance clusters
A single imbalance at one level may be random — an algorithmic spike, a large order, or market noise. Two consecutive imbalances are less likely to be a coincidence. Three in a row mean that one side systematically overwhelmed the other across several levels: this is not a random event, but sustained pressure.
The candle from the previous lesson contains two consecutive sell imbalances at 5524.75 and 5525.00. Two are already noticeable. Three or more in a row indicate that one side consistently pushed the market level by level — this is called stacking.
Here is what four consecutive sell imbalances at the 5522.50–5521.75 levels look like — hover over the red cells:
Stacking works as a filter. A single imbalance is often noise. A cluster of three is rarely random. The more consecutive imbalances there are, the stronger the context for a possible continuation.
Finished and unfinished auctions
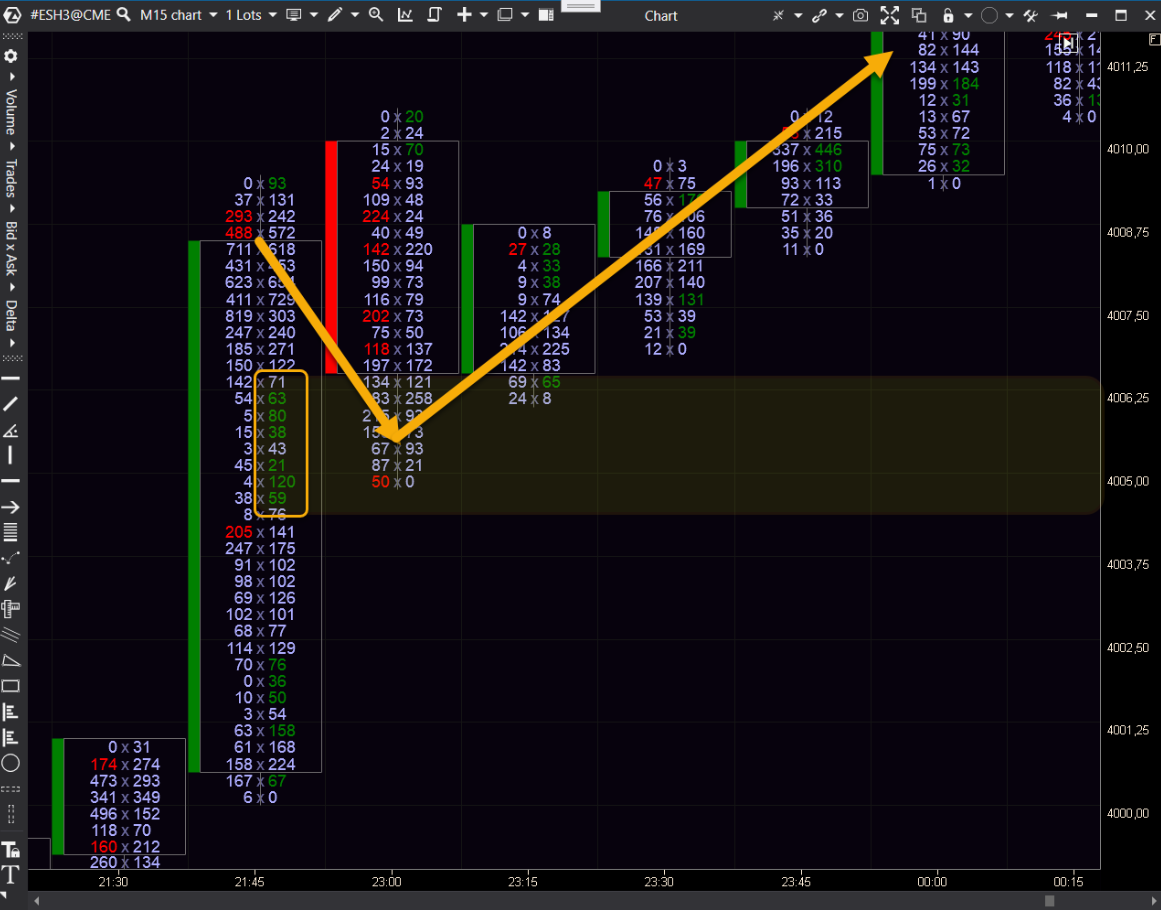
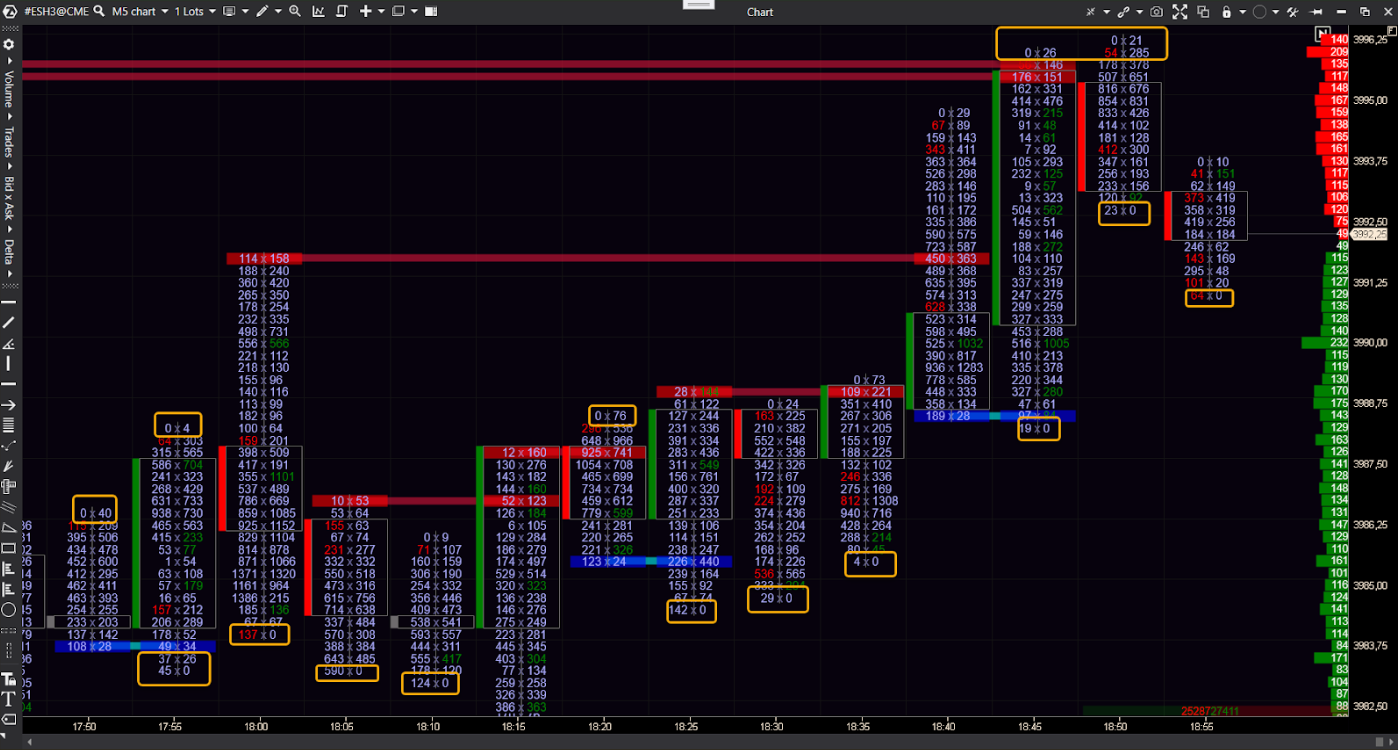
Look at the edges of the candle. At the high (5526.00): bid = 0, ask = 52. At the low (5524.75): bid = 85, ask = 0. At each edge, one column is zero.
A zero at the edge means a finished auction. Price reached this level, attempted to move farther, found no interest, and reversed. The opposite side did not execute there, which means the market had resolved the price level. Everything that needed to be tested was tested.
The situation can also be different. Suppose the candle low shows bid = 85 and ask = 28. Both sides were active at the lower edge. Sellers pushed lower, buyers responded upward, and the candle moved away, but the auction remained unresolved. This is an unfinished auction — both values at the edge are non-zero. Price may return to this area for an additional test because the market has not completed the auction.
Compare the two examples: on the left, both edges are finished (zeros); on the right, the auction at the low is unfinished:
The principle: a zero at the edge means the auction is finished. Non-zero values mean it remains open. Unfinished edges can act as magnets because price often returns to test the unresolved area.
Special indicators can highlight finished and unfinished auctions. In the image below, unfinished auctions are shown with horizontal lines, while finished auctions are marked with rectangles.
Absorption: from the fruit market to numbers
In Module 1, we explained absorption with a metaphor: a seller brings more goods out from under the counter, a buyer takes them, and the seller brings out another batch. Volume is enormous, but price remains in place.
In a Footprint chart, absorption appears as unusually high volume at one level. Both bid and ask contain many contracts. Delta at the level is close to zero. Price does not move or barely advances.
ES, level 5520.00. The Footprint of a 5-minute candle shows a doji, with price barely moving:
1,400 contracts were executed at one level — fifteen times more than at adjacent levels. Ask = 1,285: aggressive buyers repeatedly executed against limit sellers at 5520.00. Bid = 115. Buyers dominated the executed volume. Yet price remained in place.
Translated into the language of the fruit market: buyers arrived and took goods from the counter — 1,285 contracts, one order after another. Each time, the passive seller brought out more supply and offered it at the same price. Buyers kept applying pressure, but price did not move because someone on the other side absorbed the entire flow.
The signature of absorption is anomalous volume at a level + clear dominance by one side + price remaining in place. Delta shouts “buyers!”, but the result is a doji. On a candlestick chart, almost nothing stands out: a small candle, an ordinary moment. In the Footprint, there are 1,500 contracts and an otherwise invisible participant defending the level. An X-ray reveals what a photograph cannot.
Buyers may become exhausted and price may move lower — the participant absorbing the flow has accumulated a position and is controlling the level. Or the absorbing side may fail to hold, and price may break through. Both outcomes are possible. Absorption is not a forecast, but an observed fact: someone is standing at the level and absorbing the flow. What happens next depends on whether that participant has enough remaining liquidity.
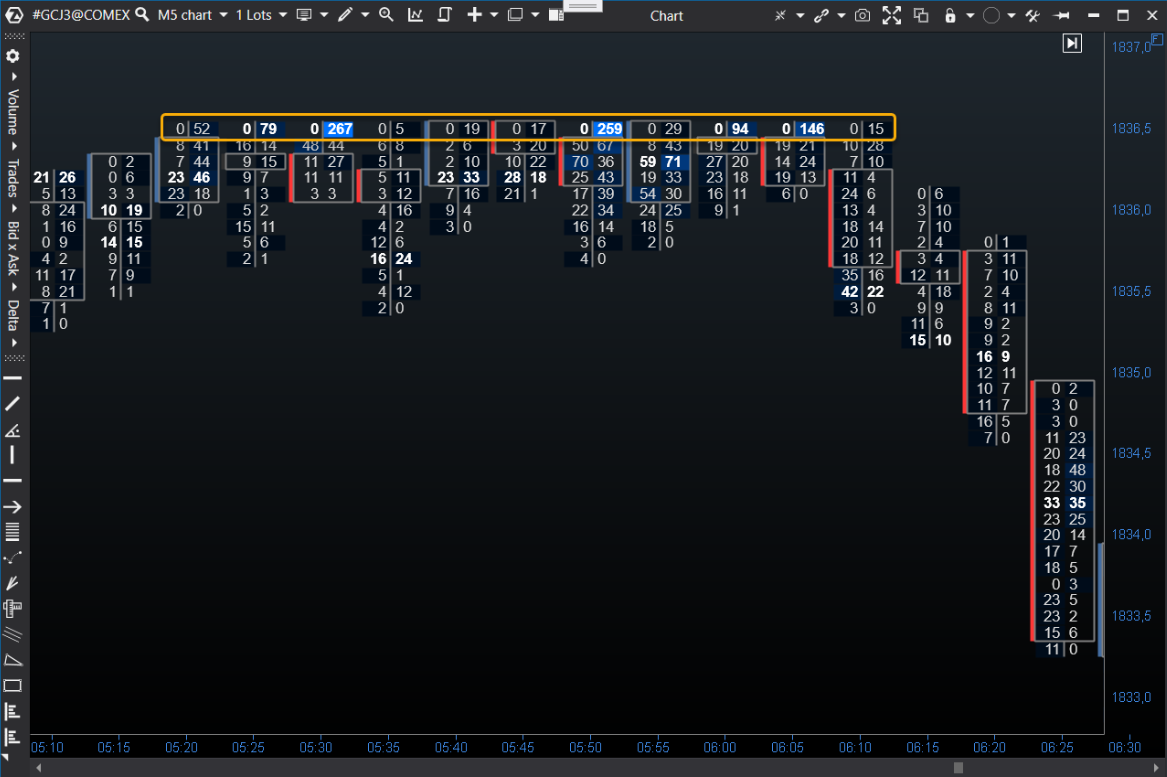
Study this example: at the highlighted price, large volume is executed through market buys, with no market sells. This means all buyers are pressing into a limit order but cannot break through it. The bid price never reached the highlighted level, and no sell executions occurred there.
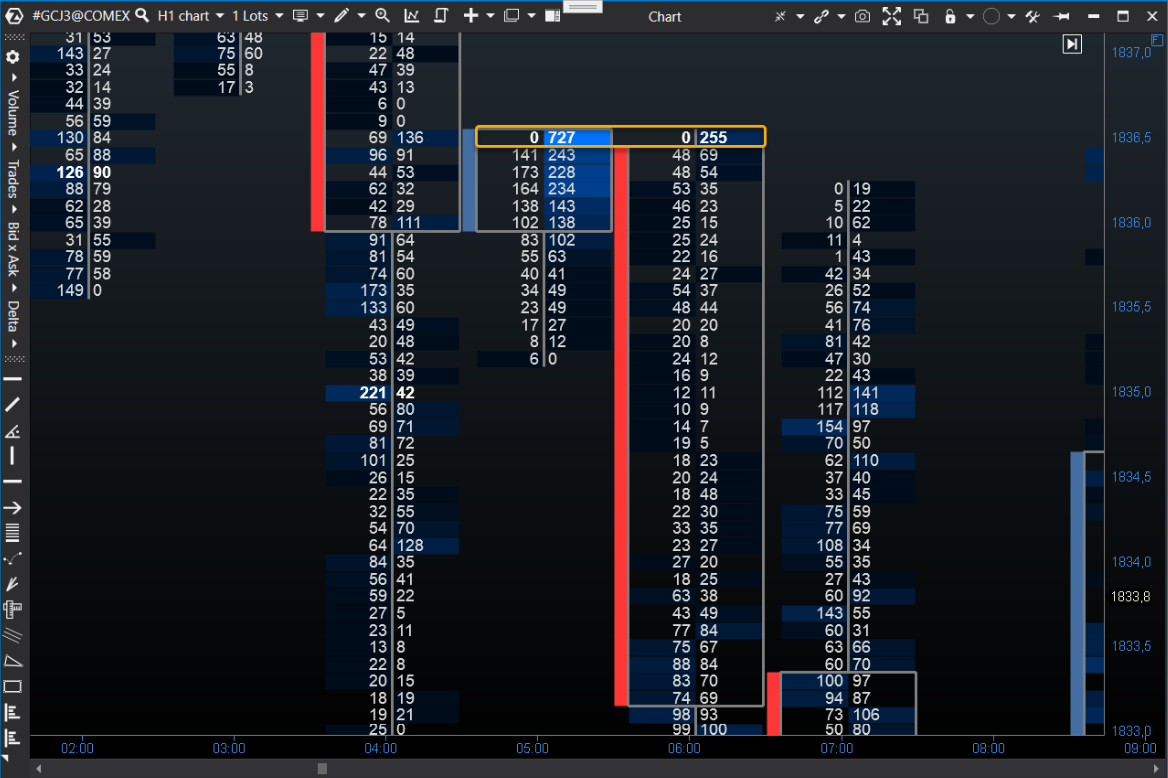 When the same section of the chart is viewed on a lower timeframe, the detail becomes clearer: there was a “wall” of limit orders that buyers could not break through.
- Stacking: three or more consecutive imbalances help filter noise and indicate sustained initiative
- A finished auction (zero at the edge) means the market resolved the level; an unfinished auction may attract a retest
- Absorption: anomalous volume at a level + delta ≈ 0 + price remains in place — a large participant is absorbing the flow
- Patterns combine several elements; one element without context is not a signal