How to Read a Footprint
The example from the previous lesson was simplified for learning purposes. In the real market, hundreds of orders and thousands of contracts pass through a five-minute ES candle. Here is the result — a green ES candle, up 3 ticks, with a volume of 1,549 contracts:
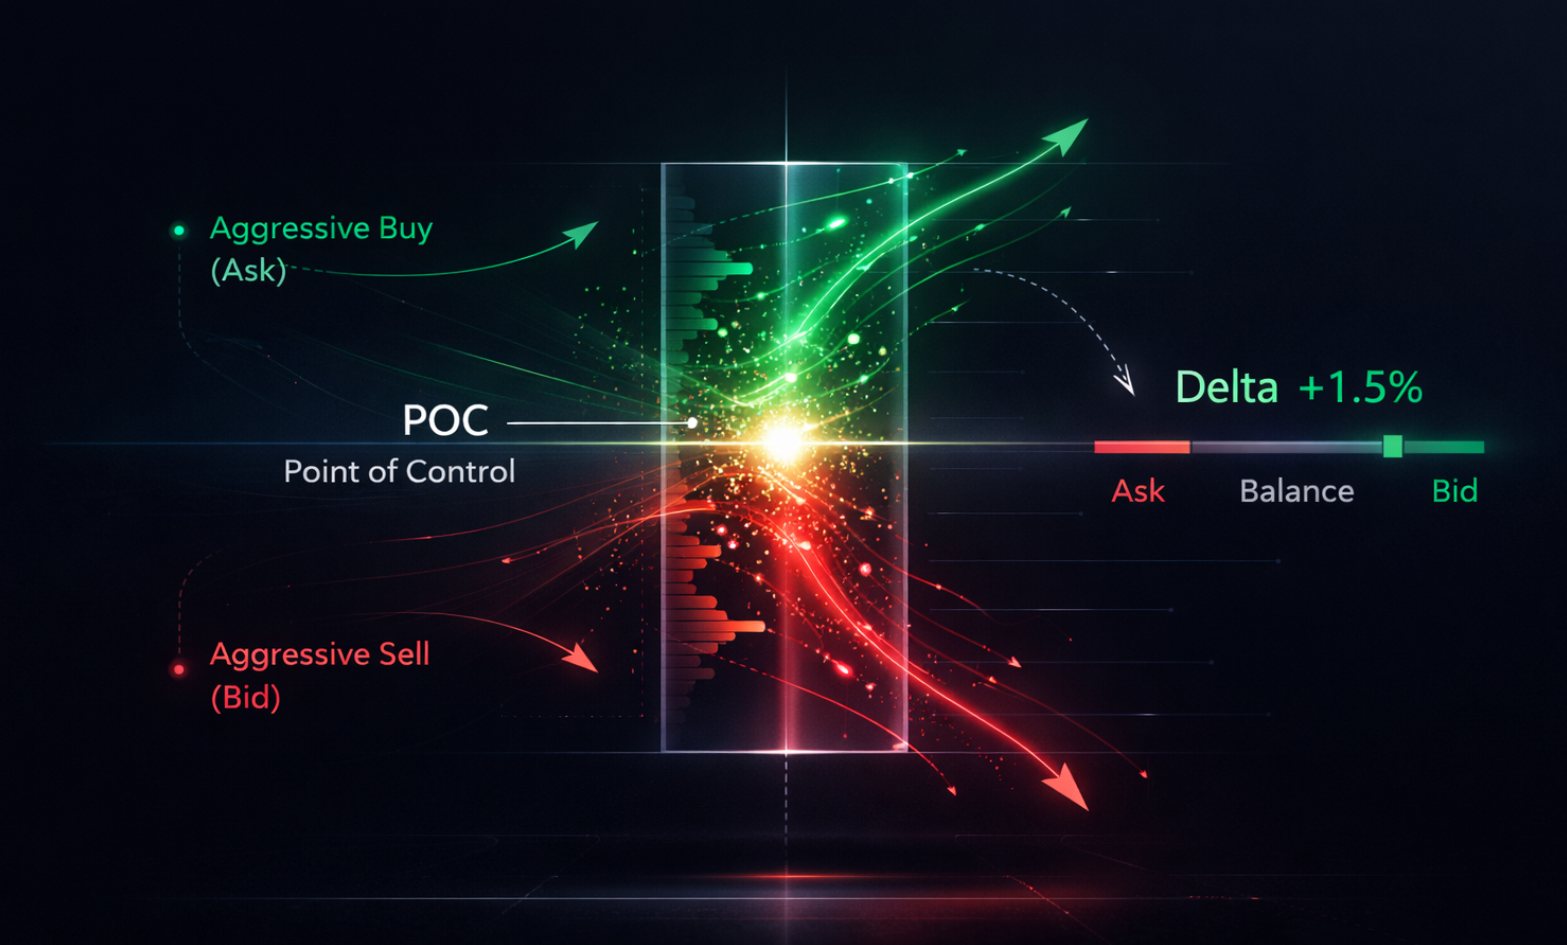
The first thing to look at is the POC (Point of Control). This is the level with the highest total volume: bid + ask. Here it is 5525.50: 110 + 295 = 405 contracts. More trades occurred at this price than at any other level — the market showed the greatest interest here. The POC is the gravitational center of the candle.
The second thing is the distribution between the two sides. In the upper part of the candle (5525.75–5526.00), the ask dominates: 340 + 52 = 392 aggressive buys versus 18 aggressive sells. Buyers were pushing the price upward. In the lower part (5524.75–5525.00), the bid dominates: 310 + 85 = 395 sells versus 24 buys. Sellers were applying downward pressure. The middle (5525.50–5525.25) is the battle zone: both sides are active, and neither side wins convincingly.
The third thing is the edges of the candle. At the high (5526.00): bid = 0. At the low (5524.75): ask = 0. A zero at the edge means that the price reached this level, reversed, and there was no movement back through it. The auction is complete — the market has no further interest beyond this point. But sometimes it looks different, and we will discuss that shortly.
Using these three elements, you can read the story of the candle. It is green, up 3 ticks, and looks bullish. The X-ray says: “draw.” Buyers dominate at the top, sellers dominate at the bottom, and the result is inconclusive. A candlestick chart would mark it as “bullish.” The footprint adds a question mark.
Bar Delta
A footprint can be reduced to a single number that summarizes the balance of aggression across the entire candle.
Delta = total contracts at the ask − total contracts at the bid.
For our candle:
- Ask: 52 + 340 + 295 + 75 + 24 + 0 = 786
- Bid: 0 + 18 + 110 + 240 + 310 + 85 = 763
- Delta: 786 − 763 = +23
A positive delta means there were slightly more aggressive buys. But +23 out of 1,549 total contracts is negligible.
Delta percentage = delta ÷ volume × 100 = 23 ÷ 1,549 × 100 ≈ 1.5%.
One and a half percent. This is a balanced candle: neither side dominates.
Reference points:
- Below 5% — balance, with no convincing winner.
- 10% and above — initiative, with one side applying clear pressure. Such candles often start or continue a directional move.
- 5–10% — a gray zone. Check the context: does the delta match the candle direction, and are there imbalances inside?
The delta of a single bar is a snapshot. What happens if you accumulate delta bar by bar throughout the entire session? You get cumulative delta (CVD) — a curve showing how the balance of aggression shifts over time. When CVD says one thing and price says another, this can be one of the most powerful order flow signals. But that is the topic of Module 4. For now, remember the formula and the thresholds.
- POC is the gravitational center of the candle, the level with the greatest market interest
- A zero at the candle edge = a completed auction; non-zero values = an unfinished auction
- Delta = total ask − total bid; delta percentage = delta ÷ volume × 100
- Below 5% = balance, 10%+ = initiative, 5–10% = gray zone, check the context