Imbalances: why the comparison is diagonal
POC and delta are overall characteristics of a candle. Imbalances are local: they show the exact price level where one side overwhelmed the other.
The principle is simple: if aggressive buys at a level are several times greater than aggressive sells one level below, this is an ask-side imbalance. Buyers broke through the defense. If the opposite is true, it is a bid-side imbalance.
But why “one level below”? Why do we compare diagonally rather than horizontally?
Because this is how the order book is structured at the moment of execution: the best ask and best bid are separated by a one-tick spread. When an aggressive buyer executes against the ask at 5525.50, the nearest bid at that moment is 5525.25 (one tick lower). The passive seller who could have countered this buying pressure was resting with a limit order at 5525.25. That is why the comparison is diagonal: it reflects the actual mechanics of the order book.
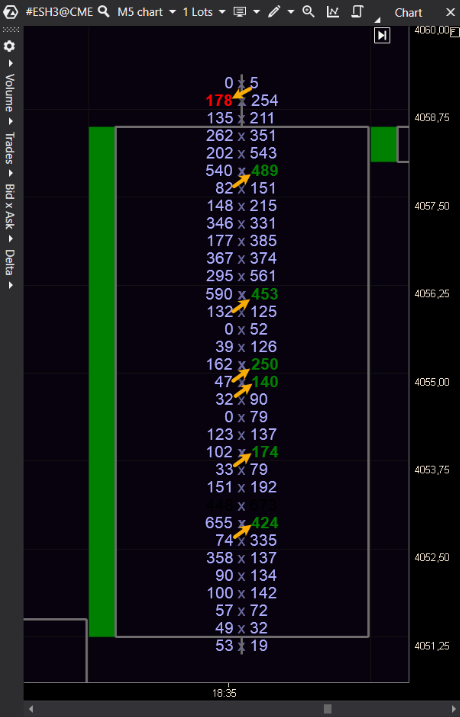
Rule: if the ratio is ≥ 2x (200%), it is an imbalance — one side is twice as strong. If it is ≥ 4x (400%), it is a strong imbalance, indicating suppression. The 200% and 400% thresholds are standard and can be adjusted for a specific instrument and timeframe when needed.
Let’s check every level of our candle:
Sell imbalances:
| Level (bid) | Bid | vs Ask (level above) | Ratio | Imbalance |
|---|---|---|---|---|
| 5524.75 | 85 | vs 24 (@ 5525.00) | 3.5x | 200% |
| 5525.00 | 310 | vs 75 (@ 5525.25) | 4.1x | 400% |
| 5525.25 | 240 | vs 295 (@ 5525.50) | 0.8x | none |
Buy imbalances:
| Level (ask) | Ask | vs Bid (level below) | Ratio | Imbalance |
|---|---|---|---|---|
| 5525.75 | 340 | vs 110 (@ 5525.50) | 3.1x | 200% |
| 5526.00 | 52 | vs 18 (@ 5525.75) | 2.9x | 200% |
Two clusters. At the bottom are sell imbalances: sellers dominated at 5524.75 and 5525.00. At the top are buy imbalances: buyers applied pressure at 5525.75 and 5526.00. The middle has no imbalances — it is a balance zone.
The candle told its story in four numbers (OHLC). The Footprint told it in twenty. And the story turned out to be more complex.
- Imbalances are compared diagonally: ask at level P vs bid at level P−1
- The diagonal comparison reflects the actual mechanics of the order book (best ask vs best bid)
- The 200% (2x) threshold indicates an imbalance; 400% (4x) indicates a strong imbalance
- Imbalances show local dominance, not the overall direction