Footprint types: four views of the same data
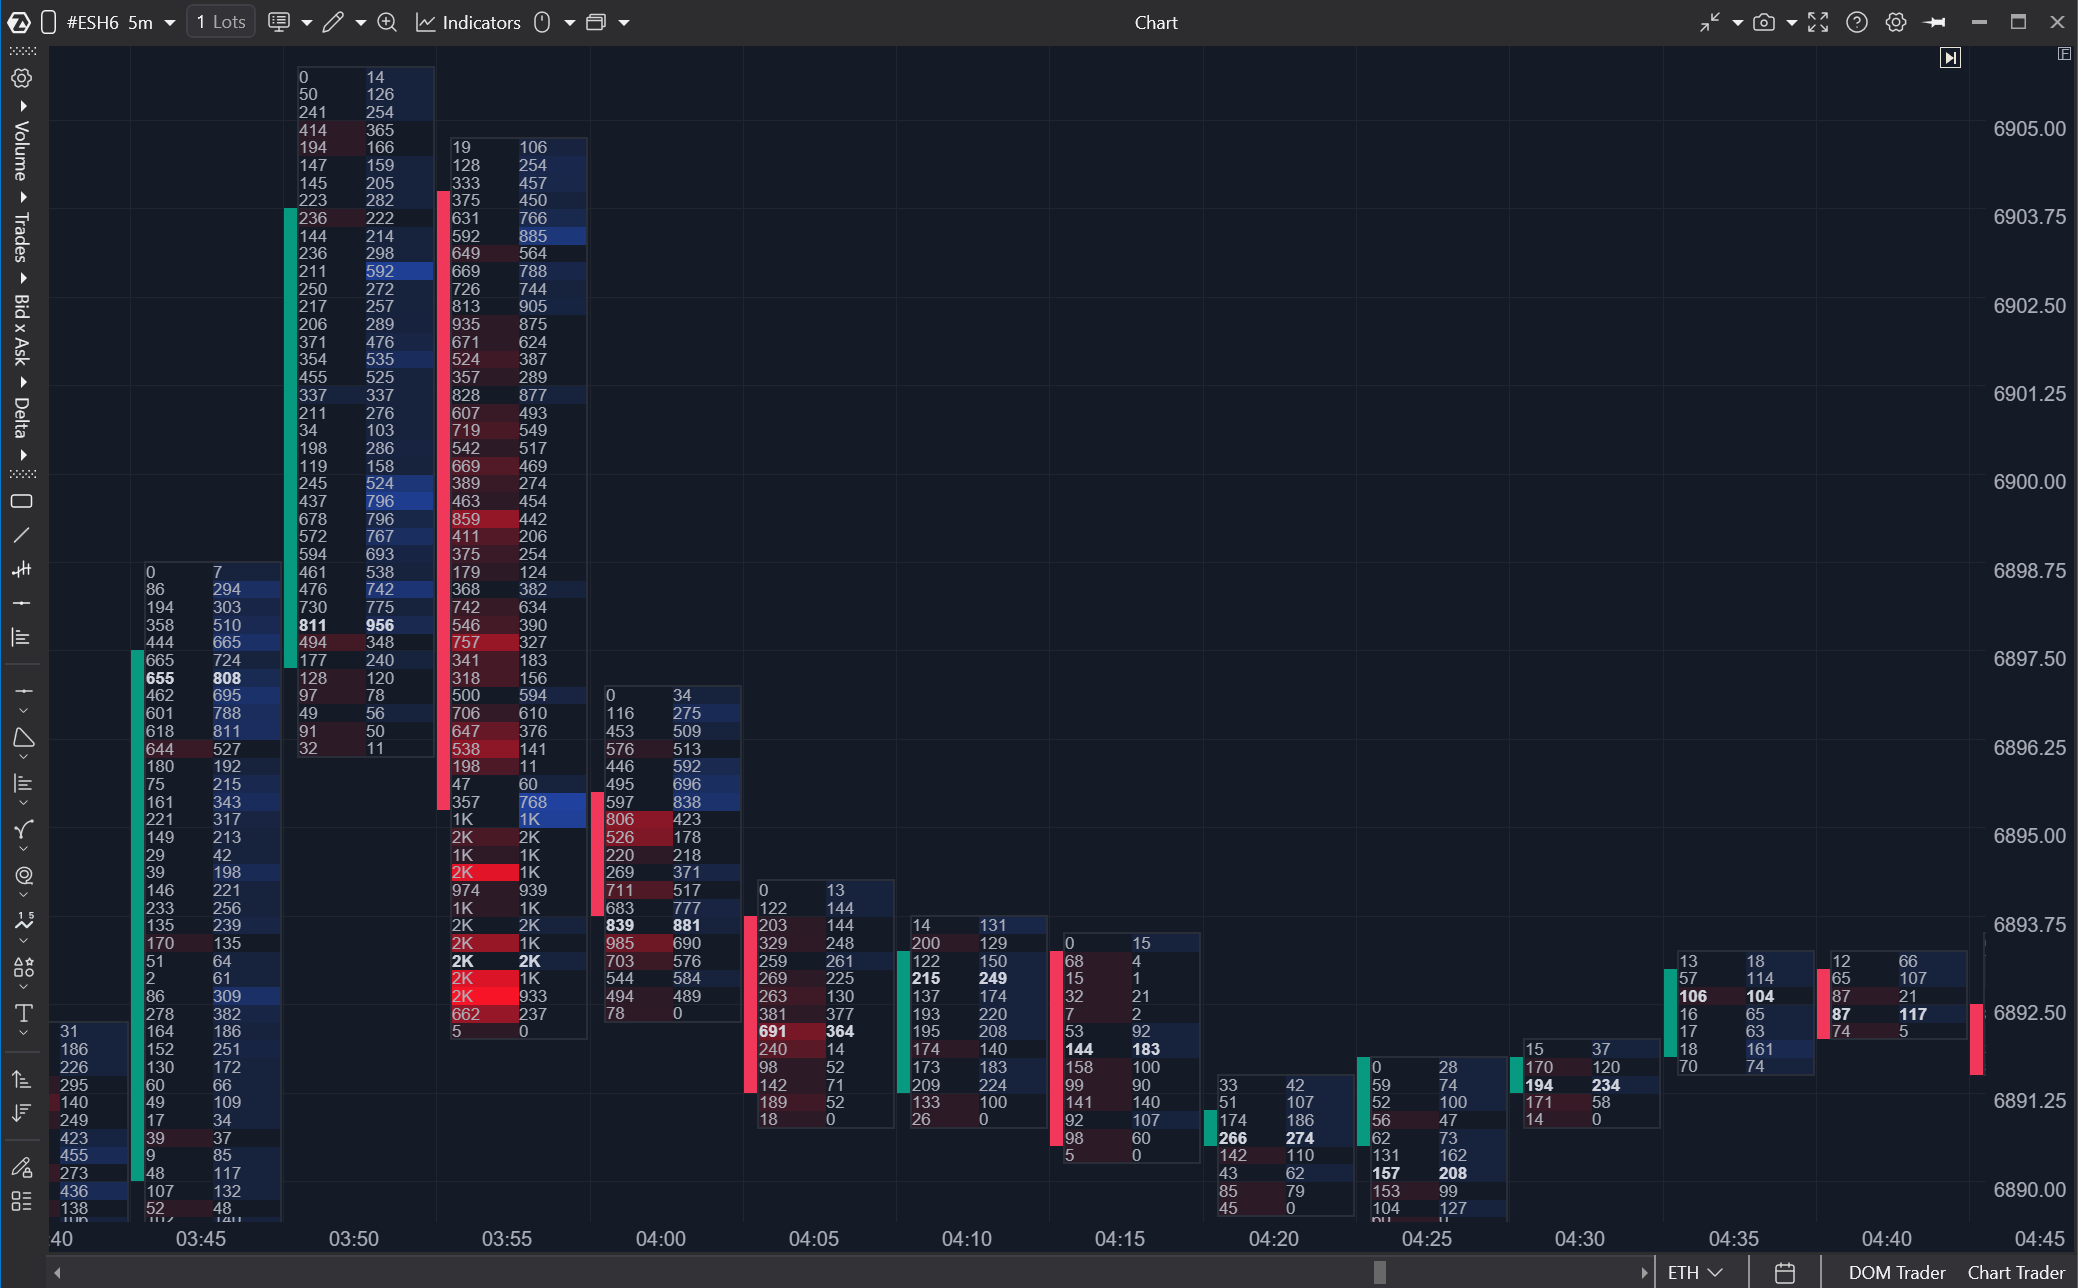
Bid/Ask Footprint is the standard view we have worked with so far. Two columns, with aggressive buys and sells shown at each price level. It provides the most detailed information. However, platforms also offer other ways to display the same data.
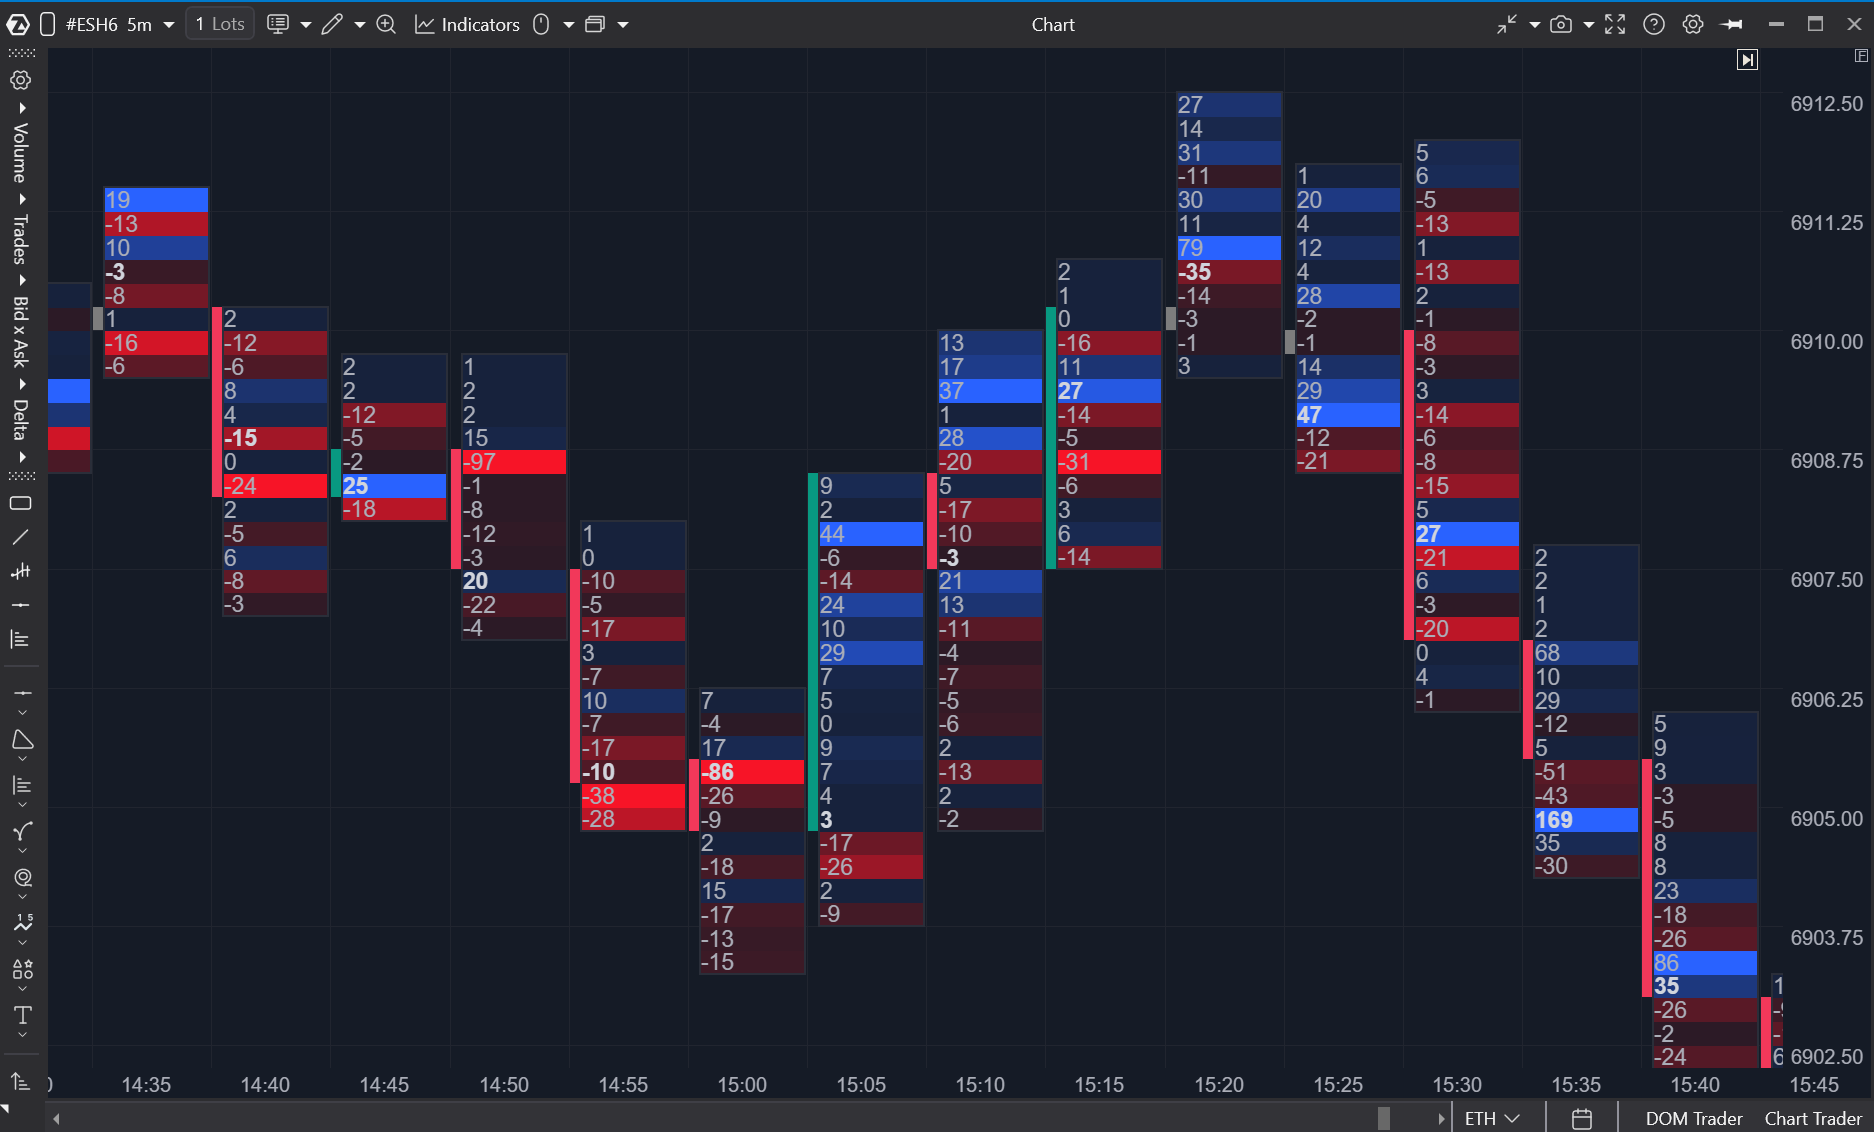
 Delta Footprint. Instead of two columns, each level shows a single value: ask − bid. A positive value means buyers were more aggressive; a negative value means sellers were. It gives you a quick view of the balance at each price level. However, it hides the scale: a delta of +20 may represent 520 buys and 500 sells (a battle) or 22 buys and 2 sells (low activity). The numbers are identical, but the situations are not.
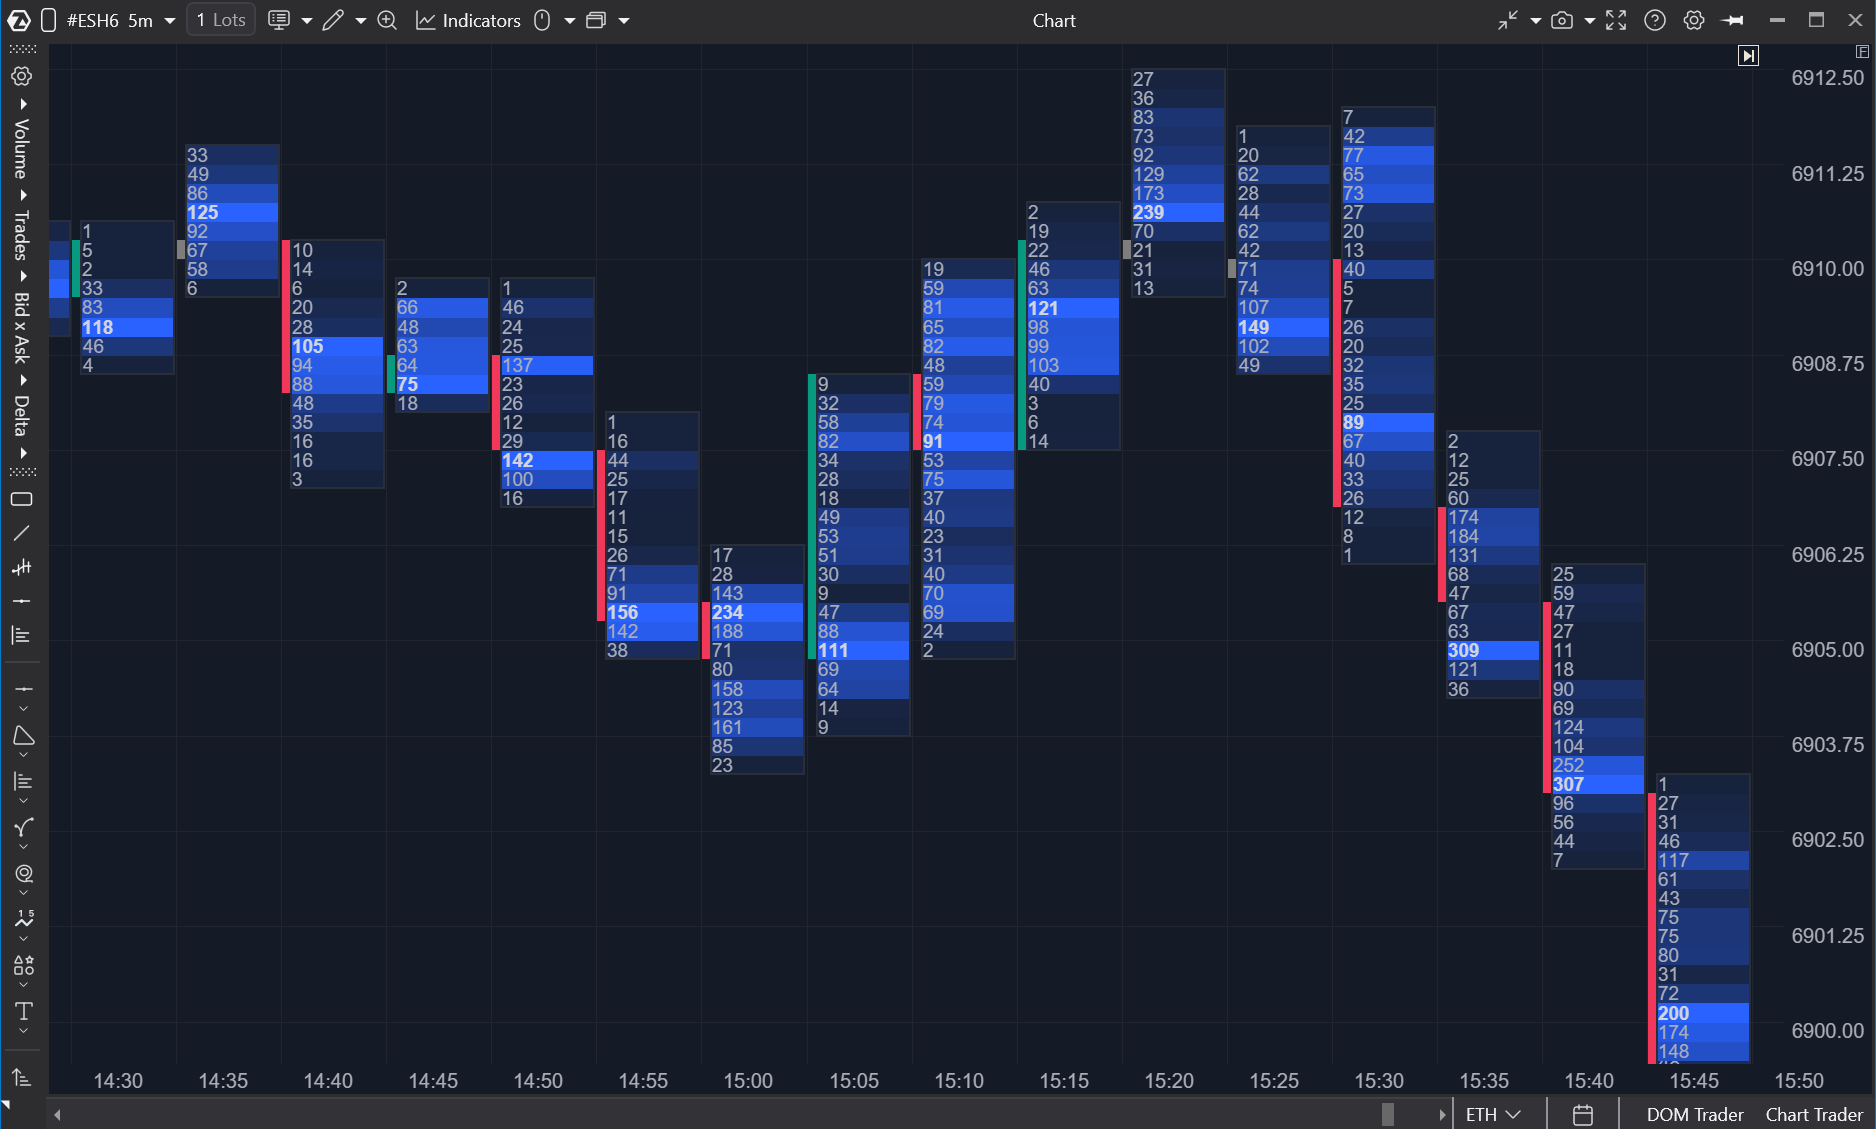
Volume Footprint. Shows total volume (bid + ask) at each level. Essentially, it is the Volume Profile of a single candle. It shows WHERE the market found interest, but not WHO was the aggressor.
 Volume Profile Footprint. A visual histogram of the same total volume: horizontal bars of different lengths next to the candle. A long bar means high volume and an area of interest. A short bar means the market moved through the level quickly.
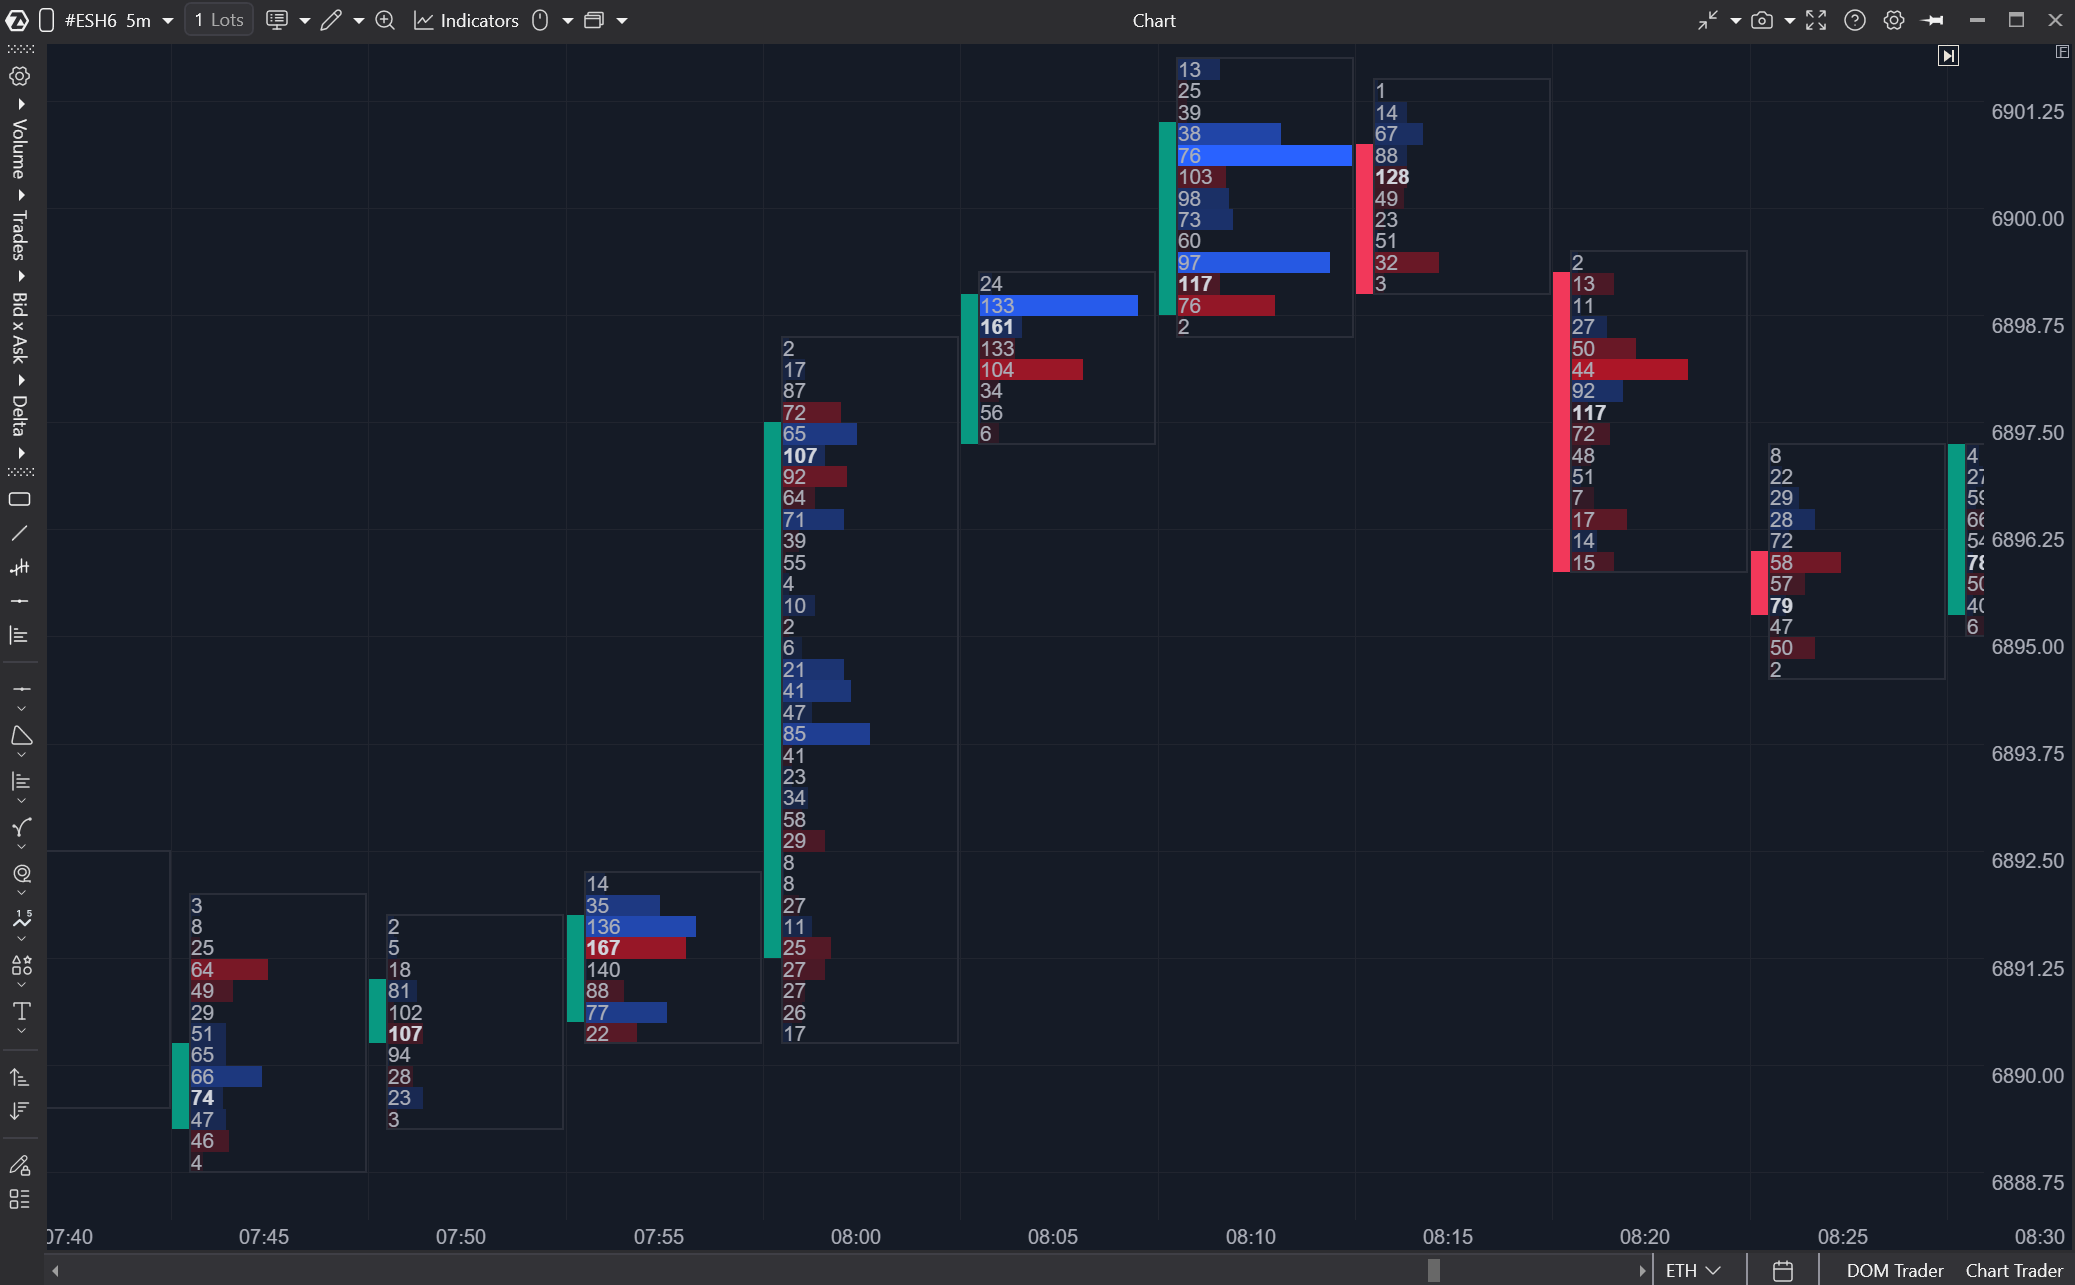 All four views are different projections of the same matching engine data: Bid/Ask provides the most detail for reading patterns, Delta gives a quick view of the balance, Volume shows the scale of activity, and Profile provides a visual map and broader context. The best choice depends on the task.
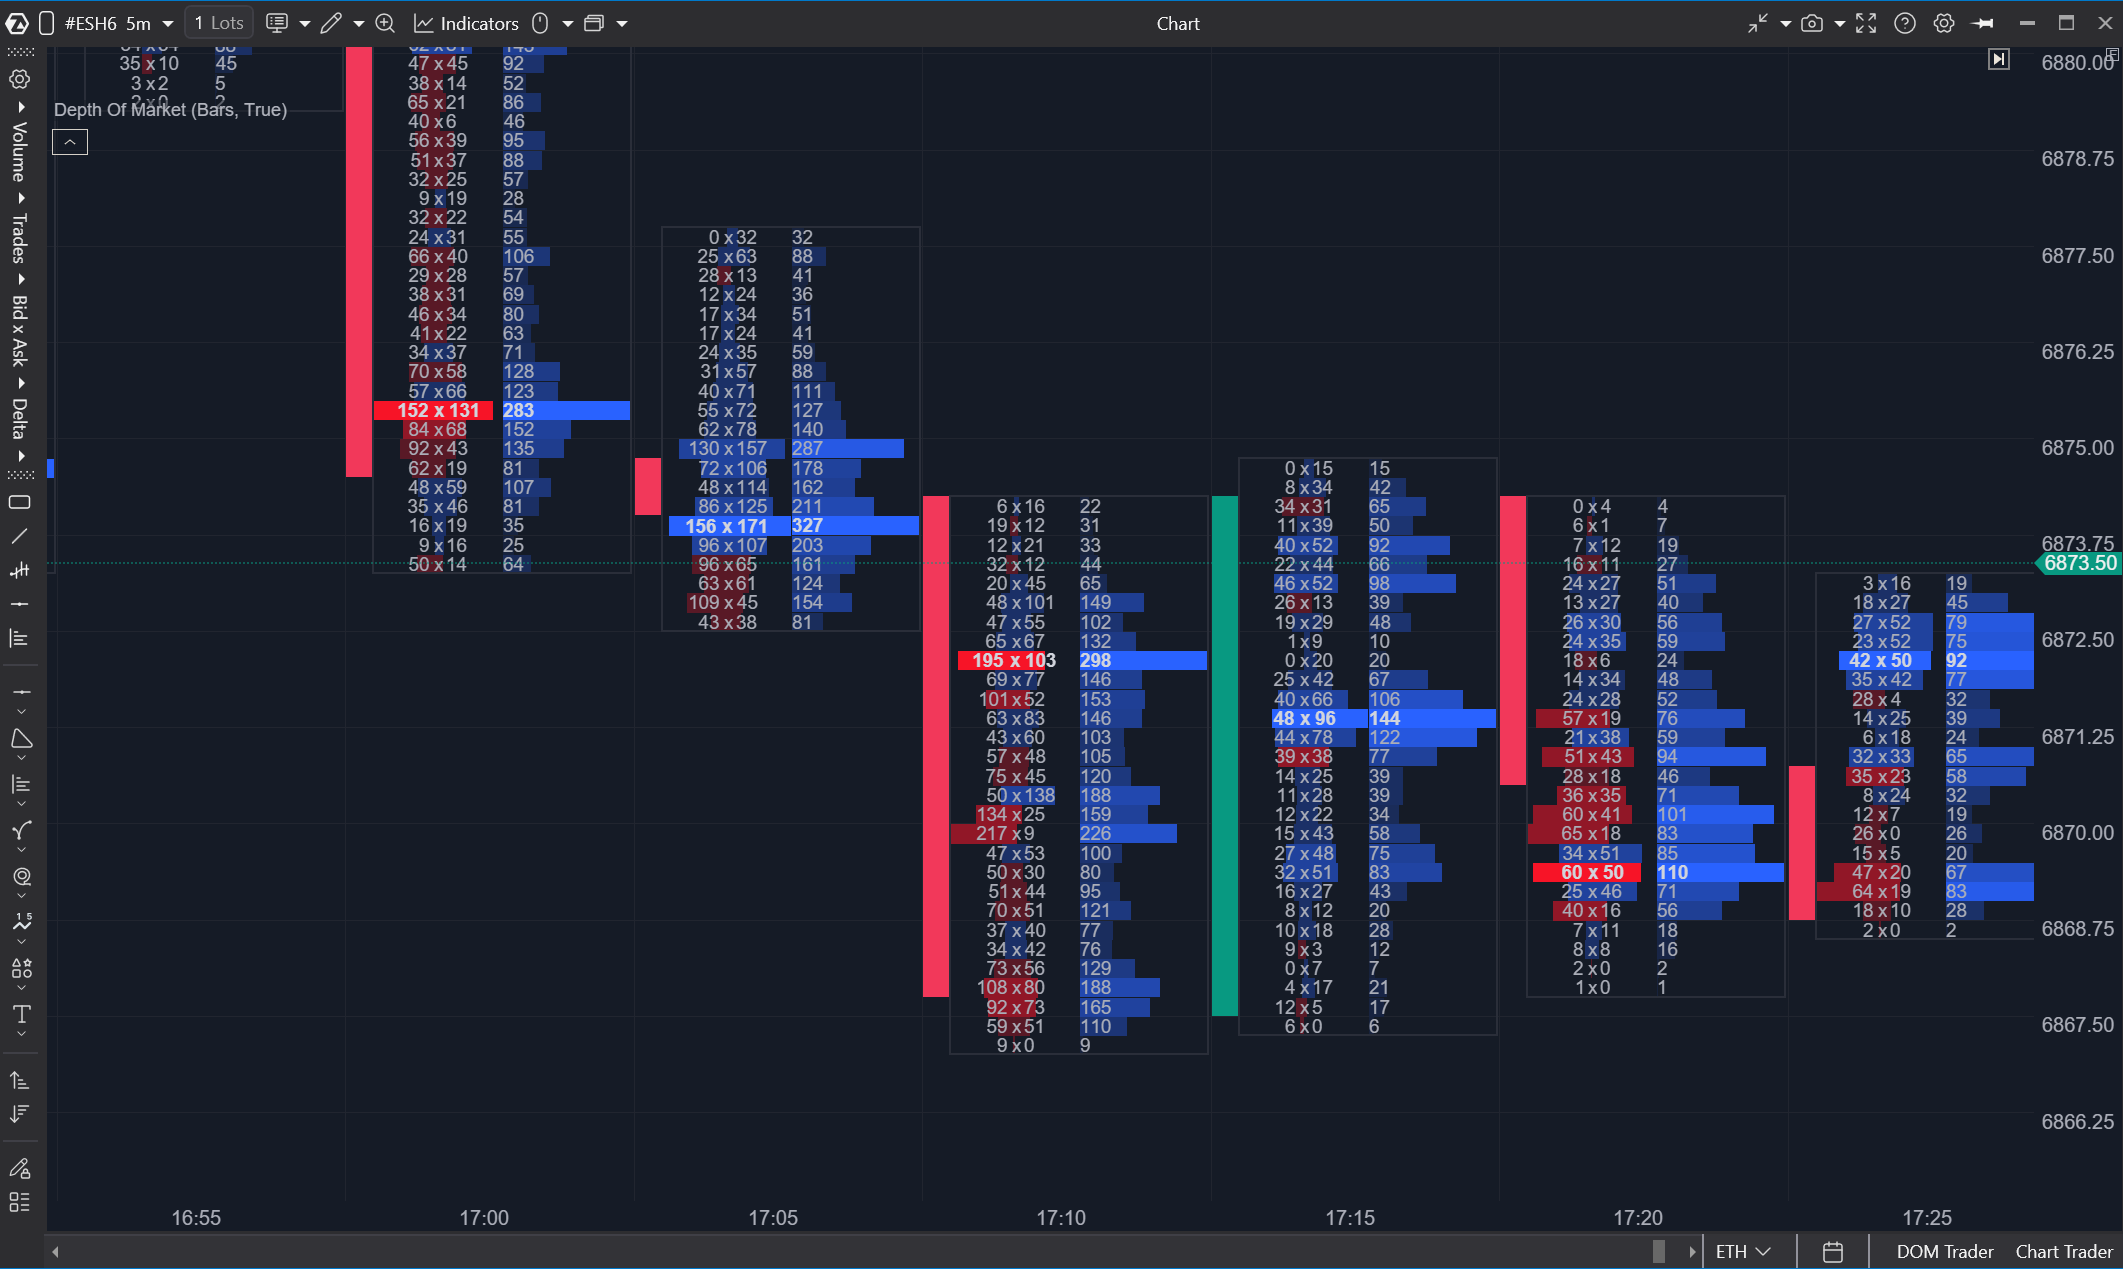
ATAS lets you combine different types of Footprint data within a single candle. The image below shows a Bid/Ask profile colored by delta, with a Volume Profile next to it. This provides maximum detail without losing context.
Numbers: benchmarks by instrument
“Large volume” is a relative concept. A volume of 500 contracts in a five-minute ES candle may be normal background activity. The same 500 contracts on NQ may already stand out. On Binance BTC futures during the overnight session, it may be anomalous.
| Parameter | ES (E-mini S&P) | NQ (E-mini Nasdaq) | BTC (Binance Futures) |
|---|---|---|---|
| Average 5-minute candle volume (RTH) | 8,000–15,000 | 4,000–8,000 | depends on the day |
| Imbalance threshold | 200% / 400% | 200% / 400% | 200% / 400% |
| “Initiative” delta percentage | 10%+ | 10%+ | 10%+ |
| Anomalous volume at a level | 3x+ vs adjacent levels | 3x+ vs adjacent levels | 3x+ vs adjacent levels |
The 200%, 400%, and 10% thresholds are universal because they are relative and work consistently across markets. Absolute values, however, vary by instrument. You do not need an indicator to understand them — open ten ordinary sessions and observe what is normal for that market. Anything three times higher already deserves attention.
How to calibrate: open 10 ordinary sessions for your instrument. Check which volumes at individual levels are typical. Anything 3 times higher or more is anomalous. This is how you develop a feel for the numbers — something no indicator can fully replace.
Footprint in ATAS
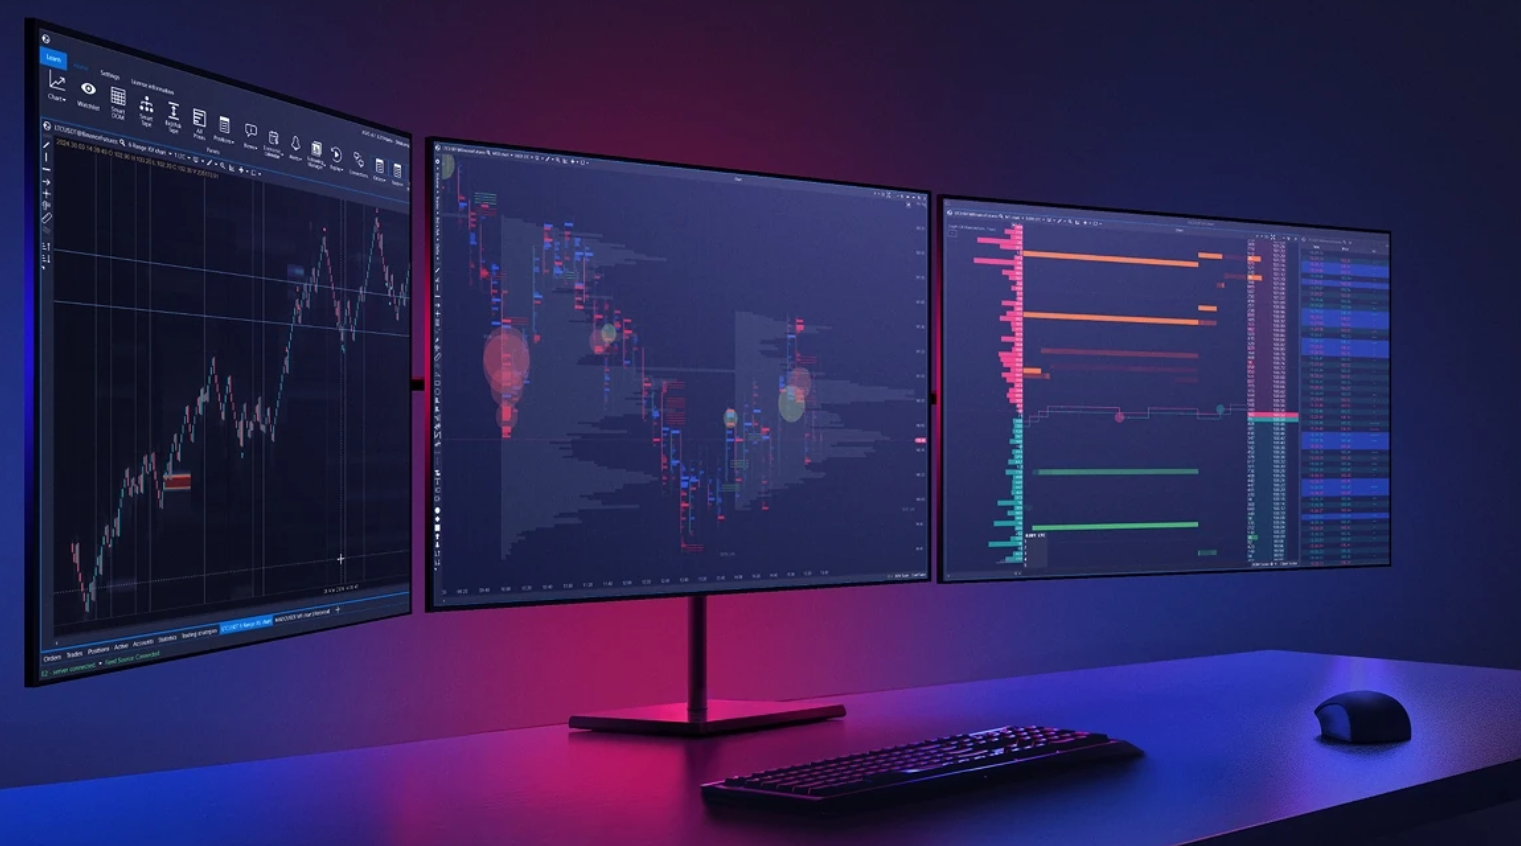
The ATAS volume analysis platform offers more than 400 Footprint visualization combinations
⊘ This does NOT mean
“High volume at a level ≠ buyers won.” High volume simply means many executions took place. Every execution is a match between an aggressor and a passive participant. If bid and ask are approximately equal, it may indicate a battle without a clear winner or absorption. To understand which side dominated, check the delta at the level. Volume itself reflects activity, not direction.
“An imbalance ≠ a reliable analytical signal.” An imbalance shows local dominance by one side at a specific level — one data point, nothing more. It may be an algorithmic spike, a random large order, or noise. The picture becomes more meaningful in context: three consecutive imbalances, an imbalance at a key Volume Profile level, or confirmation from CVD. One imbalance without context is like one candle without a chart.
“Footprint shows where price will go.” Footprint shows what happened: who was the aggressor, where volume was executed, and where an imbalance appeared. It provides data, not a forecast. Footprint can improve the depth of your analysis, but it does not guarantee a specific outcome.
“Large delta ≠ price must move.” Delta may be +500 while price remains in place because a large limit order or iceberg order on the other side is absorbing the entire flow. Delta shows the balance of aggression, not the resulting price movement. The outcome depends on who is standing on the other side.
- Bid/Ask provides maximum detail; Delta shows the balance quickly; Volume shows the scale; Profile provides a visual map
- Absolute values depend on the instrument; relative thresholds (200%, 10%) work across markets
- Footprint shows what happened, not where price will go — it provides data, not a forecast
- Large delta does not guarantee price movement — absorption may be taking place